
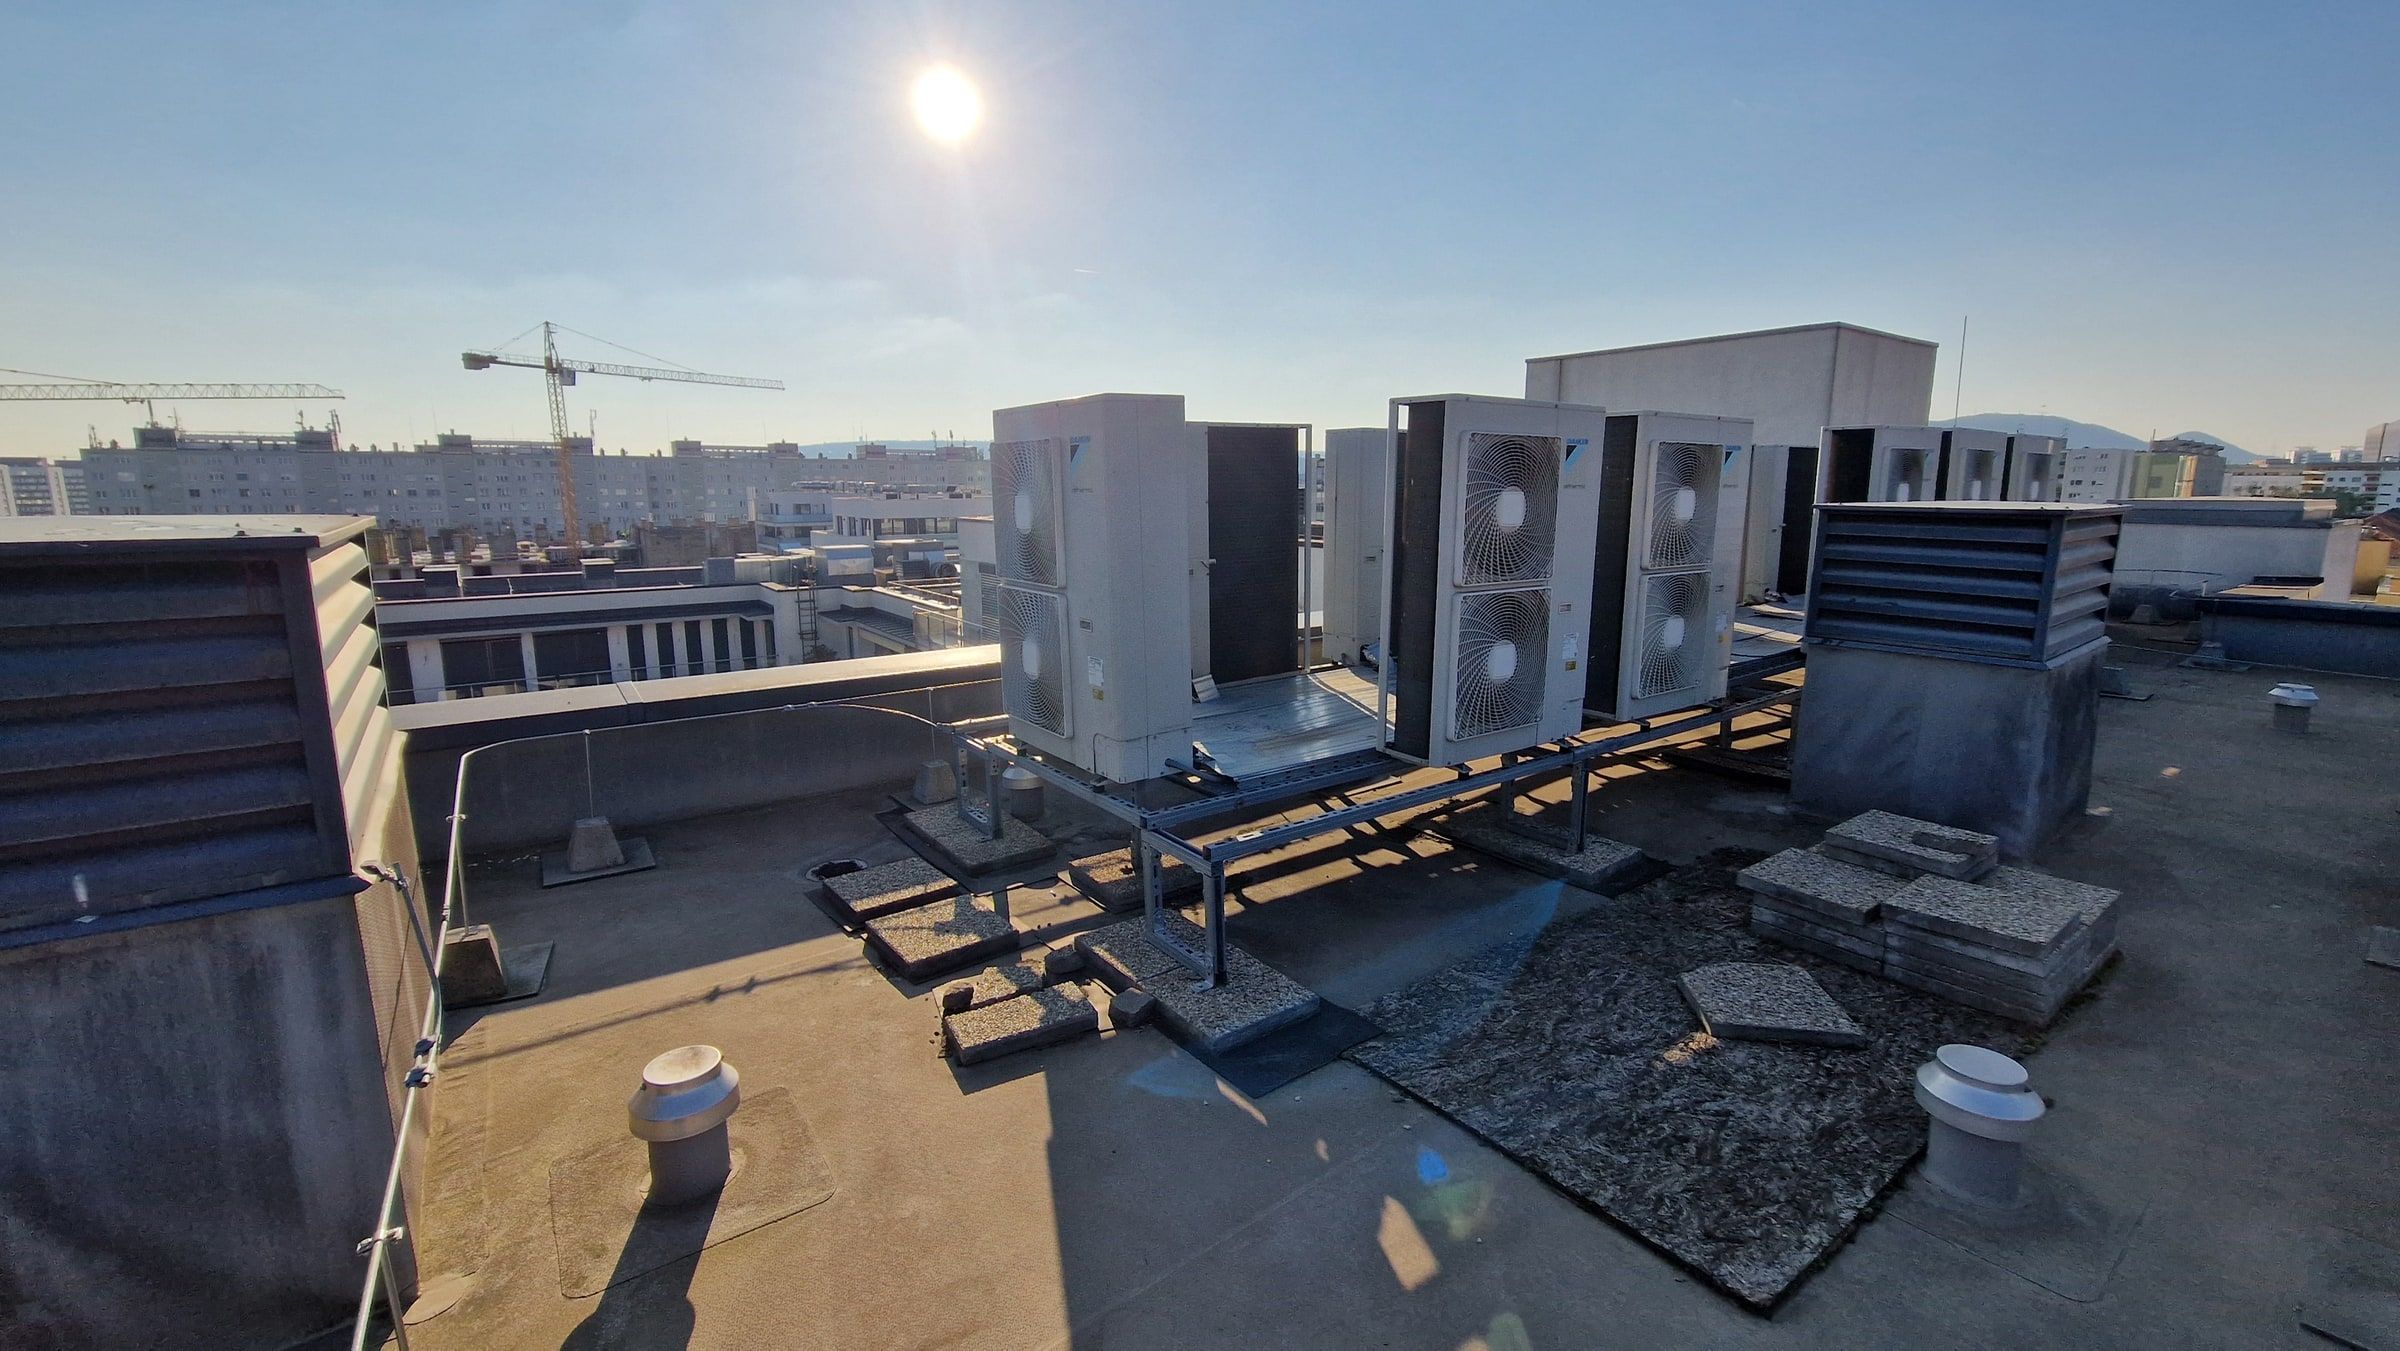
A 192 kW heat-pump plant—monitored remotely and controlled according to demand.
At this property, Metraon evolved from a tool for one-time remote meter readings into a complete operational platform. Today it collects data from more than 1,000 measurement and control points, builds a retrievable operational history, supports technical analysis, and adapts heat-pump operation to the building’s current demand.
- Property
- 52-apartment residential building
- Heating plant
- 12 × 16 kW Daikin Altherma 2 heat pumps
- Functions served
- Heating, cooling, and domestic-hot-water production
- DHW storage capacity
- 6,000 litres
- Connected system
- More than 1,000 measurement and control points
- Metraon’s role
- Remote meter reading, monitoring, analysis, reporting, and demand-based control
- Measured and managed data
- Temperature, flow rate, thermal energy, DHW consumption, and control and communication states
What the incident demonstrates
The response described here is the author’s account of the live pilot. The under-30-minute interval runs from the hot-water report to checking the state and making a remote adjustment. It does not measure full temperature recovery or establish an energy-saving result. The measurement sources, equipment, and communication path are described below; customer-identifying details are withheld.
The equipment and data were available—but there was no unified operational picture that could be used remotely.
Before Metraon was introduced, the building already had the necessary meters, heat pumps, controllers, and communication devices. However, their data did not come together in a single, retrievable operational picture that could be used remotely.
When a problem occurred, it was difficult to determine quickly what had happened immediately beforehand, which equipment was affected, and how current operation differed from normal behaviour.
The task was therefore not to install another isolated dashboard. First, the heat-pump system, domestic-hot-water production, meters, controllers, and data connections had to be understood as one interconnected building-services system.
A one-time reading became a continuous operational platform
The first version of Metraon performed a one-time remote reading of the heating meters and exported the results in Excel format.
That initial tool gradually developed into a continuous operational system:
- Meter readings were collected regularly.
- Measurements began to be stored in a central database.
- Every value was linked to the relevant meter, equipment, and technical system.
- Historical trends, cumulative values, and changes between periods became available.
- Different measurement sources could be compared.
- Heat-pump demand calculation and control were connected to the same operational platform.
Today, the pilot processes data from more than 1,000 measurement and control points.
A current value is often not enough
Live measurements show the system’s current state. The cause of a building-services deviation, however, can often be understood only from the data recorded in the preceding hours or days.
Metraon therefore not only displays measurements but also retains them in connection with the relevant equipment and systems. This allows operators to:
- compare current operation with previous operating states;
- calculate cumulative energy and consumption values;
- examine changes between measurement periods;
- track domestic-hot-water consumption;
- cross-check the same physical value using independent sources;
- connect operational data with reports and billing calculations.
For example, a heat pump’s outlet-water temperature can be checked using both a PT1000 temperature sensor and a heat meter.
A difference between the two sources may draw attention to measurement or operating conditions that would remain hidden in an isolated controller interface.
Remote response during a DHW supply problem
Domestic-hot-water production in this building represents a significant and time-varying heat demand. The system operates with 6,000 litres of storage capacity, and the heat pumps need time to restore the tanks to their target temperature after high or irregular consumption.
Cold, humid, and foggy weather can increase the frequency of heat-pump defrost cycles. This can temporarily reduce the thermal capacity available for DHW production.
During one such period, the property manager reported a domestic-hot-water supply problem.
Using Metraon, we remotely checked the current tank temperatures and the state of the heating plant. We then enabled additional heat pumps to increase the capacity available for DHW production.
The state was checked and the remote adjustment completed less than 30 minutes after the report, without waiting for an initial on-site inspection.
The operational value did not come merely from remote switching. In the same system, the operator could see the current measurements, the related operating states, and the control option needed for the adjustment.
Flow-rate trends made troubleshooting more targeted
In another case, the monitored flow-rate data showed behaviour that differed from normal operation.
Current and historical measurements indicated that one side of a twin circulation pump was not operating correctly. The data narrowed down the equipment likely to be affected, allowing the hardware fault to be passed to the repair technician with substantially more technical context than a general complaint could provide.
Metraon does not replace on-site diagnostics or the repair of defective equipment. It helps the technician begin the investigation with more targeted information.
Remote monitoring became demand-based control
Based on measured heating and DHW demand, Metraon can determine how many heat pumps need to operate.
Control logic running in the cloud sends the required commands via MQTT to the Linux-based gateway installed in the plant room. The local gateway communicates with the existing system through Modbus TCP, M-Bus-to-Modbus bridges, and Modbus-based I/O relays.
When the controller requests additional capacity, the gateway executes the required relay commands. This allows the number of operating heat pumps to be adapted to heating and domestic-hot-water demand.
The system therefore not only shows what is happening; it can also adjust operation based on measured demand.
The existing infrastructure remained; its usability increased
The building-services equipment already in operation did not need to be replaced to implement the pilot.
Metraon created a connected operational layer around the building’s existing meters, heat pumps, communication bridges, controllers, and relays.
In this project, data collection and control are provided by:
- MQTT;
- Modbus TCP;
- M-Bus-to-Modbus bridges;
- Modbus-based I/O devices.
The approach can also be adapted to other existing building-services systems once their topology, data connections, and operating logic have been mapped.
Next step: direct electrical feedback
The current system already provides remote monitoring, historical analysis, demand-based control, and remote operational response.
The next development step is to introduce direct three-phase current measurement at the power supply of every heat pump.
This feedback will make it possible to verify more reliably whether individual units are actually drawing electrical power and how their load changes. Together with the existing temperature and thermal-energy data, it may later support more accurate operational verification and fault detection.
The additional feedback may later enable:
- automatic identification of units that are not operating or unavailable;
- fault-tolerant selection of operating heat pumps;
- balancing of operating hours;
- automatic use of backup heat sources;
- predictive DHW control;
- more accurate comparison of electrical and thermal energy use.
These capabilities belong to the pilot’s next development stage. They are not presented as current production features.
What did the pilot demonstrate?
The project demonstrated that an existing building-services infrastructure can be supplemented—without complete replacement—with a data and control layer that:
- provides continuous remote monitoring;
- makes the system’s previous operation retrievable;
- makes problem investigation more targeted;
- enables remote adjustment;
- adapts heat-pump operation to measured demand;
- supports reports and billing calculations from the same data set.
At this building, Metraon evolved from a one-time meter-reading tool into part of day-to-day operation.
How a usable operational layer was built on top of the existing system.
Map the system
We mapped the building-services topology, equipment operation, control logic, meters, communication devices, and relevant Modbus registers.
Establish the local data connection
We installed and configured the plant-room gateway. The existing meters, M-Bus-to-Modbus bridges, Modbus devices, and I/O relays remained in use.
Build the operational history
The system reads measurements regularly and stores them in the cloud. Every value is linked to the relevant meter, heat pump, heating circuit, or technical system.
Monitor remotely and control according to demand
Current states and historical trends can be reviewed remotely. Metraon calculates current demand and regulates the number of operating heat pumps without requiring a site visit.
See what is happening now—and understand what led to it.
Metraon does not display isolated measurements. Measurements remain connected to equipment, control actions, and previous operating states, allowing current operation to be compared with the system’s earlier behaviour.
- Continuously monitor the building and heat pumps remotely.
- Retain a retrievable history of measurements and control actions.
- Compare values from independent measurement sources.
- Calculate cumulative consumption and changes between measurement periods.
- Coordinate heat-pump capacity with heating and DHW demand.
- Investigate reported problems using current and historical data.
- Prepare operational reports and billing calculations from the same measured data.
- Extend the system without replacing infrastructure that is already working.
This case study presents a live pilot project at a specific residential building. The property’s location and customer-identifying details are not disclosed. The operational events and system functions described are real; however, no verified energy or cost savings are claimed at the project’s current stage.

Show us the building-services system that is difficult to understand remotely today.
The first step is not to replace the existing system. We map its topology and operating logic, then connect the measurements and controls that provide the greatest operational value.